

Download the PDF here.
2024 Q4 – 2025 Q1 Review
Please know that we are aware of the long length of these letters and the challenge it is to read them. The letters are intended to keep you well informed, aware of what we are seeing and thinking, and aid to help us clarify the economy and market for our decision making. In addition to the Executive Summary, we attempt to provide a bold font or underlining for emphasis of key information and summary sections as an option to shorten your reading time. There are a considerable number of key facts, analysis, and anecdotal evidence omitted from each of these reviews.
Executive Summary
- In our last review, we covered the Federal Reserve’s confidence that inflation was on a sustainable path to their target of 2%. Proof of their confidence was the implementation of a 1% reduction in the Federal Funds rate between September and the end of the year 2024.
- Further, although the economic growth pace was slowing a titch, we felt that the economy had avoided a recession while curing high inflation and would maintain a positive glide path.
- Mr. Trump’s election released animal spirits in the stock market with the prospects of a more probusiness approach, a more favorable corporate and individual tax regime, and a lighter regulatory approach.
- As it turns out, import tariffs were also high on the priority list. We have witnessed the imposition of high tariffs that are on-again and off-again. C-suite dreams of lighter regulations have been met with a stream of tariff policy changes. Companies are having trouble tracking tariff requirements let alone planning around them. Decisions on acquisitions, deployment of capital, hiring, or even ordering inventory has become precarious.
- In the past three months economists have changed their outlook for the USA to slower growth, higher inflation, and greater risk of recession.
- This month the S&P 500 has twice turned back from the cusp of a bear market (defined as down 20%) and the small-company Russell 2000 index as well as the NASDAQ index hit the 20% decline threshold. This brings back the emotions of the market decline during COVID. During COVID, the Federal government and Federal Reserve were just as concerned as citizens were. This resulted in the deployment of massive fiscal and monetary policy. In this case, the Tariff situation is self-inflicted.
- The market is a near term voting machine and longer term weighing machine. It is clear that the market is not a fan of the tariff situation.
- We appreciate the news of countries reaching out for negotiations as opposed to tariff retaliation. It is our hope that at the end of the 90 day negotiation period, we will see trade barriers lowered around the world.
- To date we do not see evidence of lower growth and higher inflation as tariffs were not a factor through March. We will know more in the months ahead.
More on Tariffs
- We are firm believers in the free capitalistic system as well as free trade. These systems foster the efficient deployment of capital.
- We know that there are several countries where we do not enjoy fair trade, where there are barriers to entry beyond the uneven tariff landscape. It is laudable to rectify these situations where possible.
- Mr. Trump’s feelings about free trade and the loss of manufacturing capacity in the USA go back to the 1980’s, thus are deep-seated. While we share some of those concerns, there has been good and bad that has come of the offshoring of high labor content jobs.
- In history, the offshoring of high labor / lower tech manufacturing jobs to Mexico, China, India, other Asian nations, and African nations has enabled the maintenance of lower inflation in the USA.
- This has come at a cost to our middle class laborers. We have seen studies that indicate middle class labor has not had an increase in annual income other than the inflation rate over the past fifty years.
- The movement of lower tech / high labor content jobs out of the country has enabled the deployment of resources and leadership into higher technology industries and services industries that have led to greater productivity through automation and higher paying jobs.
- As a nation, we have allowed products (examples: micro-processors and rare earth metals/magnets) that are critical to our national security to be produced outside of our borders.
- Bringing manufacturing back to the USA on a large scale is not an overnight endeavor. In many product cases three to five years would be the short term scenario. There are some products that are just not feasible from a cost standpoint to produce in the USA.
- The uncertainty of the eventual tariff end point serves to delay supply chain changes.
- We hope that the use of large import tariffs is a temporary negotiating tool. Leaving larger import tariffs in place would be ill-timed from the standpoint of higher inflation. As a nation, we experienced a stepwise increase in inflation during Covid due to the shortage of goods supply. The import tariffs would induce a second stepwise increase in inflation. This would add to a painful lowering of purchasing power, especially for those in the lower income deciles.
- We stand in support of and hope for negotiations that lead to the lowering of barriers towards free trade. We also support the use of positive incentives to draw manufacturing back within our borders.
Macro-economic Perspectives
- Macro-economic Summary
- Real GDP growth still looked good through to 2024 year end. Recent projections from the Federal Reserve, economists polled by the Wall Street Journal, the International Monetary Fund, and banks all point to higher inflation and slower growth. Yet forecasting is difficult within the changing tariff picture.
- Corporate earnings growth has been solid through 2024. But the projections for earnings growth for the S&P 500 in Q1 2025 have been lowered from 13% to 8.5% this year.
- Personal net worth gains continue to impress.
- Real disposable income growth has slowed to 2% this year from 4% in 2023 and real consumer spending is consistently rising. All other things equal, this would help bring inflation into the FED’s target.
- The personal savings rate is slowly declining.
- Employment: unemployment has risen to a still low level, and the hiring pace has slowed.
- Overall, the consumer is in reasonably good shape.
- Projecting economic growth and inflation has become a challenge. Business leaders and economists are in a wait and see position.
- We have seen positive quarterly Real GDP growth in the USA since the 2nd quarter of 2022. Annual growth in 2022 was 2.5%, 2023 was 2.9%, and 2024 was 2.8%. The annual growth streak goes back to 2021, which was 6.1%. In 2020, annual Real GDP change was -2.2% after the Covid induced “shutdown” led to -5.5% in Q1 and -28.1% in Q2.
- Below is the projection from the Federal Reserve Bank’s Federal Open Market Committee (FOMC) of twelve members provided in December and March for change in Real GDP, unemployment rate, inflation, and the Federal Funds rate.
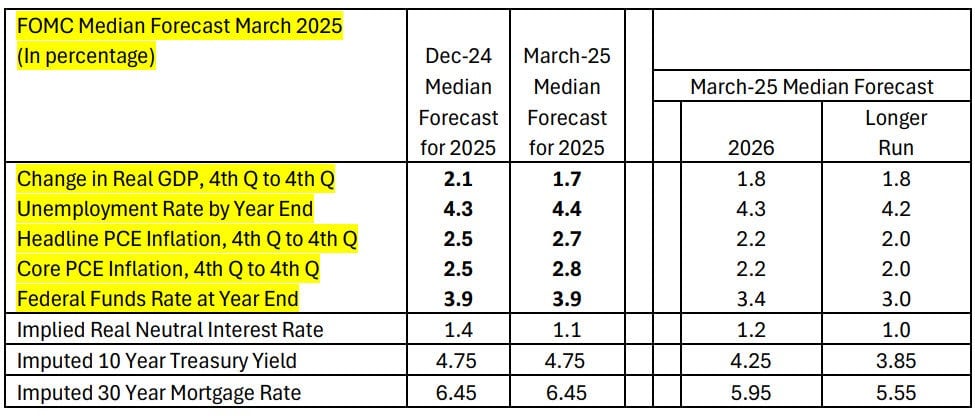
- They forecasted lower GDP, higher unemployment, and higher inflation in March. This is prior to Mr. Trump’s base and reciprocal tariff announcement in April. The FED indicated that the tariffs were much higher than anticipated. Further, they plan to go on hold regarding monetary policy to study the impact of tariffs. This can be seen in the unchanged forecast for the Federal Funds rate at year end (a reduction of 0.5% from today’s federal funds rate) in spite of higher projected inflation.
- Projections for the S&P 500 year over year earnings growth for the 1st quarter have declined from 13% early this year to 8.5% at present. Could this be the first sign of a slowdown?
- Companies reporting earnings for Q1 2025 have beaten projections 65% of the time. This compares to the typical beat rate in the 80s.
- Major banks are reporting evidence of corporations taking a business planning timeout and bolstering their balance sheets until there is clarity on tariffs.
- The velocity of money (the frequency at which one unit of currency is used to purchase goods and services within a given period) has risen from a bottom in Q2 2020 of 1.13 to 1.387 in Q4 2024 but is still very low when compared to the historical average of about 1.8. This remains counter inflationary.
- Money Supply (M2 – cash, checking and savings deposits, money market mutual funds, and CDs). The Federal Reserve Bank appears to have ended their effort to shrink money supply in February or March of 2024. M2 had been increasing at an increasing rate but seems to have leveled off just below 4%. Historically, normal economically supportive growth rate is between 3% and 6%. Nominal M2 money supply remains supportive of consumer activity.
- Inflation: In March, the Federal Reserve did not change their forecast for achieving 2% inflation by 2026.
- Annualized PCE inflation was 2.5% in January and February this year, it was 2.6% at 2024 year end.
- Annualized PCE Core inflation (excluding food and energy) was 2.7% and 2.8% in January and February, respectively. This compares with 2.9% in December 2024.
- Consumer financial well-being by some measures has slipped since Q1 2024.
- Household net worth was up 9.3% year over year in 2024 at $160.346 trillion. This followed an 8.2% increase in 2023. Household net worth continues to be supportive of economic growth. The first chance to see any meaningful change in household net worth will be in September when the 2nd quarter household net worth is reported. Source: Federal Reserve.
- Year over year real disposable income (after inflation) has risen every month since January 2023. Although, the rate of increase has slowed from 4.7% in 2023 to 2% in 2024. The annualized rate has been below 2% in January and February this year.
- Year over year, real personal consumption expenditures, a comprehensive measure of consumer spending, show rising expenditures after adjusting for inflation throughout 2022, 2023, 2024 and continuing through February this year. The rate of increases has not slowed down since early 2022 (when Covid stimulus was still in play).
- The personal savings rate has declined from 6.2% in 2019 prior to the pandemic, after rising to double digit levels in 2020 and 2021. The 3 month moving average savings rate gradually declined from 5.4% to 3.8% over the last 11 months. This is not concerning at this point.
- Bank delinquency rate on all consumer loans and leases at all Commercial banks remained around 2.7% for all of 2024. This compares to 2.31% in 2019.
- Revolving consumer credit as % of disposable income has declined from 26% in 2019 to 23% at the end of 2024 (Bureau of Economic Analysis). This includes credit cards. But the interest rate on credit cards is 23% versus 17% in 2019.
- Household debt service payments as a percentage of disposable income were 11.28% at the end of 2024. This compares to 11.73% at 2019 year end.
- Employment – There has been some cooling off in the labor market. The average monthly job gains in 2023 were 251,000 per month. In 2024, the average monthly job gains were 186,000. The monthly average through March this year is 152,000
- The unemployment rate rose from 3.4% in March 2023 to 4.2% in August 2024 and remains at 4.2% now. Job openings have declined from a peak of 12,182,000 in March of 2022 to 7,568,000 in February 2025. This still accounts for a lot of unfilled jobs. The average level in 2017 through 2019 was 6.8 million. There are 1.08 openings per unemployed person.
- The four week moving average for initial unemployment claims still ranged between 213,000 and 229,000 this year. Readings below 250,000 are an exceptionally good indicator of the strength of the labor market. Readings below 300,000 still indicate monthly job growth.
Key Segments of the Economy
Consumer spending (70% of GDP): Year over year comparisons for each month have remained positive for 49 consecutive months through February 2025. The Institute of Supply Management (ISM) reading for services remained elevated above 50 for about 4 years until February 2024. Fifty is the dividing line between decline and growth. Two months out of 12 had readings below 50 in 2024. One out of three months had a reading below 50 this year in March. The services portion of the economy is still doing well but has shown a couple of minor cracks.
Manufacturing (11% of GDP): The ISM reading for manufacturing dropped below 50 in November 2022. The manufacturing economy has been a challenge since Covid. This corresponds to the rush to rebuild inventory in late 2020 through mid-2022 only to find the need for inventory reductions at retailers beginning late 2022. The effect of the pull ahead of consumer and durable goods demand during the Covid shutdown is still negatively impacting demand. Industrial production (including mining, gas and electric utilities, and manufacturing) has been flat for 2023 and 2024. It has been a better start to the year in 2025 with readings above 50 in January and February, with 49 in March. The goods portion of our economy is still in a slight recession.
Construction (4.1% of GDP): This data is not adjusted for inflation, year over year increases in total $ spent on construction (residential and non-residential) have gradually slowed from high single digits in early 2024 to low single digits in early 2025. Residential construction has slowed (down to less than 2% growth) more than Non-residential construction spending (down to just below 4% growth).
Housing affordability remains a stubborn issue. Construction permit issuance is flat at around 1.45 million per year. New single family construction runs at about 1,000,000 per year. Multi-family construction (is more volatile) runs at about 400,000 per year. New household formation is a volatile number, but it is typically higher than construction units built. Existing home sales run at around 4 to 4.1 million
units per year. The existing home supply has risen to between 3.5 months to 4 months, which is still too low.
Securities Market Perspective
In 2024, a 100% stock portfolio with 20% invested in international was up 18.44% with dividends reinvested. Intermediate term bonds (Bloomberg Aggregate Bond Index) and short-term bonds (Bloomberg U.S. Gov’t Credit 1 to 3 Year Bond Index) were up 1.25% and up 4.36%, respectively.
At the end of Q1, 2025, a 100% stock portfolio with 20% invested in international was down 2.43% with dividends reinvested. Intermediate term bonds (Bloomberg Aggregate Bond Index) and short-term bonds (Bloomberg U.S. Gov’t Credit 1 to 3 Year Bond Index) were up 2.78% and up 1.62%, respectively.
DBFM’s investment philosophy has always favored value stocks for their long-term result of higher return with less risk as compared to growth stocks. In addition, value stocks can be a reliable source of income production. Although DBFM maintains an allocation to quality (companies with good balance sheets and profits) growth stocks in the large cap stock portion of client portfolios. The portion of this allocation is dependent on each client’s situation.
By 2024 year end growth stocks outgained value stocks by 16.51%. In 2025, through Q1, value stocks outgained growth stocks by 11.55%. The uncertainty created by the fluid tariff backdrop has brought valuations to the fore and has made conservative income paying stocks more attractive.
Note: We often remark that our portfolios hold up well during periods of market declines given our focus on value and that is the case again this year. What is remarkable, is that if we take a longer term view that considers the Russell 200 Growth Index vs. the Russell 200 Value Index from 1/1/2022 – 4/22/2025 (a period dominated by 2 years of Growth outperformance in 2023 & 2024), the Value index outperformed the
Growth index by 7 basis points or 0.07%.
At the end of 2024, as measured by price to book value, growth stocks were 159% above their long-term average of 4.83 at 12.53. At the end of 2024, value stocks were 31% above their long-term average of 2.03 at 2.66. Price/earnings ratios (the price paid for $1 of earnings/share) for growth stocks and value stocks were 36.7 and 19.2, respectively. Stock valuations were on the high side.
At the end of Q1 2025, as measured by price to book value, growth stocks were 124% above their longterm average of 4.83 at 10.8. At the end of Q1 2025, value stocks were 33% above their long-term average of 2.03 at 2.7. Price/earnings ratios (the price paid for $1 of earnings/share) for growth stocks and value stocks were 30.8 and 19.0, respectively. Stock valuations were still on the high side, but growth stock valuations declined significantly.
Fixed Income: This big news in 2024 for the bond market was the Federal Reserve’s completion of a 1% reduction in the Federal Funds Rate (FFR) by year end. The FFR is the rate at which banks lend money to each other overnight. It is the rate from which other bond or loan rates are determined. Typically, the 10 year Treasury rate is 0.85% greater than the FFR, and the 30 year mortgage rate is 1.70% higher than the 10 year Treasury rate. The uncertainty created by tariff policy has reduced the FED’s projected reduction in FFR from 1% this year to 0.5% and from 0.5% in 2026 to 0.4%.
The 10 year Treasury rate is below the imputed rate in the chart on page 2 even though the FED has not reduced the FFR this year.
We are seeking to continue to $ cost average out of short term bonds into intermediate term bonds at targeted yields with the goal of achieving appreciation of bonds as the 10 year Treasury rate eventually declines.
Wrap Up
In our last letter, this was our less than comprehensive list of concerns or sources of uncertainty: wars in Europe and the Middle East, our national election, sustainability of our federal budget deficits and national debt, and economic woes in China. Note that the risk of a trade war was not on it. For now, that tops our list of concerns.
Significant gains in the stock market can lead to a feeling of additional wealth and a willingness to open one’s wallet for purchases. This is known as the wealth effect. It can also run in reverse in times of significant losses.
GDP growth was good through year end, corporate earnings growth rate projections for Q1 2025 have gone from strong to good, disinflation towards the FED’s 2% target was progressing okay through Q1, and consumer health was good with some weakening evident but not concerning.
Our strategy of a slant towards conservative investing and diversification has had positive results on performance on a relative basis, year to date. We are seeking ways to lower risk in a small, incremental fashion as we wait for positive tariff negotiations to be completed.
Keep in mind that there are too many drivers of the market for federal government policy shifts to be the controlling driver in the long term.
As always, we remain long term bullish, seeking necessary or opportunistic tactical adjustments to portfolios, and remain diversified for long term success.
Please feel free to contact us with any questions, or if you would like to schedule a face to face, virtual, or phone meeting.
Thank you,
Dave Dickmeyer, M.B.A.
Wealth Advisor
Principal Owner
Ian D. Boyce, CFP®
Certified Financial Planner™
Principal Owner
Drew Lanphear, CFP®, RICP®
Certified Financial Planner™
Director Wisconsin Office